Topic-Wise Exam Analysis A Practical Framework Schools Can Use in 30 Days
Learn a step-by-step 30-day plan to implement topic-wise exam analytics, trend alerts, and targeted interventions using MyQampus-style dashboards.
The 30-Day Story: From “Marks Uploaded” to “Students Improving”
On Day 1, most schools are here, “We have results… somewhere.”
By Day 30, you want to be here, “We know the exact topics students missed—and what we’re doing next week to fix them.” Here’s the practical framework.
Week 1: Standardize What You Measure (or analytics will fail).
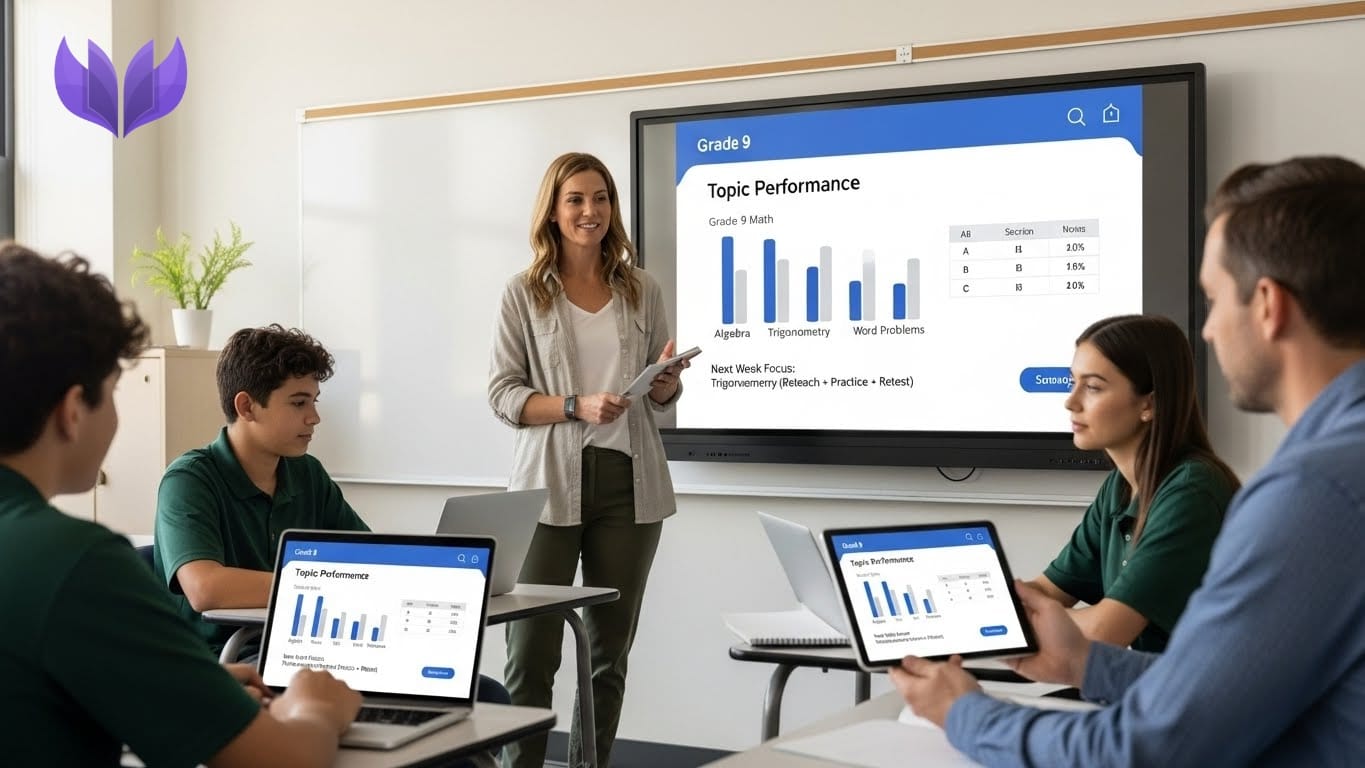
Pick one grade + one subject to start (example: Grade 9 Math).
Standardize;
- Topic list (same naming across teachers).
- Question-to-topic mapping (even if simple).
- Assessment types (unit/mid/mock).
This prevents “Trigonometry” vs “Trig” vs “Triangles” chaos.
Week 2: Build the 5 Dashboards That Matter.
You don’t need 50 reports. You need 5;
- Student topic profile (strengths/weaknesses by topic).
- Class topic heatmap (what most students missed).
- Trend tracker (3-exam rolling performance).
- Section comparison (same grade, different sections).
- Question analysis (which questions broke the class).
If your system already manages exams and marks centrally myqampus.com, these dashboards become plug-and-play because the data is already flowing into one place.
Week 3: Turn Insights Into Interventions (the part schools skip).
For every “red topic,” assign an action;
- Reteach with a different method (video, demo, peer instruction).
- Practice set focused only on that topic.
- Small group remedial for flagged students.
- 1-week retest (short, low-stakes).
This is where learning improves—because the response is specific.
Week 4: Retest and Prove Improvement (make it a system).
Retest the weak topic. Then track;
- Did the class average rise?
- Did the flagged students improve?
- Which method worked best?
Now you’re not guessing. You’re building a repeatable playbook.
The Coordinator’s “One Screen” View.
When schools centralize exams + marks and add analytics, coordinators can finally see:
- Which grade/subject is slipping.
- Which topics are consistently weak.
- Which sections need support.
- Which teaching approaches are working best (so they can be shared).
This becomes a school improvement engine—not “extra admin work.”
“New to exam analytics? Start here.
FAQs
1 How many topics should we track per subject?
Start with 8–15 major topics per term; expand later.
2 Do we need question-level analysis from day one?
No—start topic-wise first. Add question-level once teachers are consistent with tagging.
3 What’s the fastest way to show results in 30 days?
Pick one weak topic, run reteach + practice + retest, and show the improvement delta.
4 How do we prevent teachers from feeling “judged”?
Position analytics as support: identify where students need help and share what works across sections.
5 What grade should we start with?
Start with an exam-heavy grade (8–10) where interventions can quickly lift performance.